Save H₂O Initiative · Android · India

The water crisis
is invisible.
Until now.

Slow the Flow makes your hidden water footprint visible — and gives you the tools to shrink it before 2040 runs out.

Every second, 1,000L of virtual water is invisibly consumed worldwide
Projected global water crisis countdown
--
Years
--
Months
--
Days
--
Hours
--
Min
--
Sec
💧
Virtual Water
Learn about the hidden water footprint in everything we consume — from jeans to chocolate to cotton.
Cotton: 10,000L/kg · Jeans: 7,200L
Explore →
📊
Track Your Impact
Calculate your personal virtual water footprint in 60 seconds. See exactly how your habits add up.
Average user: 128,000L/year
Calculate now →
🎯
Take Action
Get a personalised water-saving plan showing which habit change saves the most water for you specifically.
Save up to 99,350L per year
Start saving →
Measured Impact

Water saved.
Time bought.

99K
Litres saved per user
per year, max scenario
716
Days of global timeline extended
if every user acts
3+
Platforms built
Android · Web · APK
1
Student founder
Delhi, India · Age 16
// NASA Earth Observatory · Aral Sea · 1960 → 2014

A lake the size of Ireland.
Gone in 50 years.

Because of the cotton in your jeans.
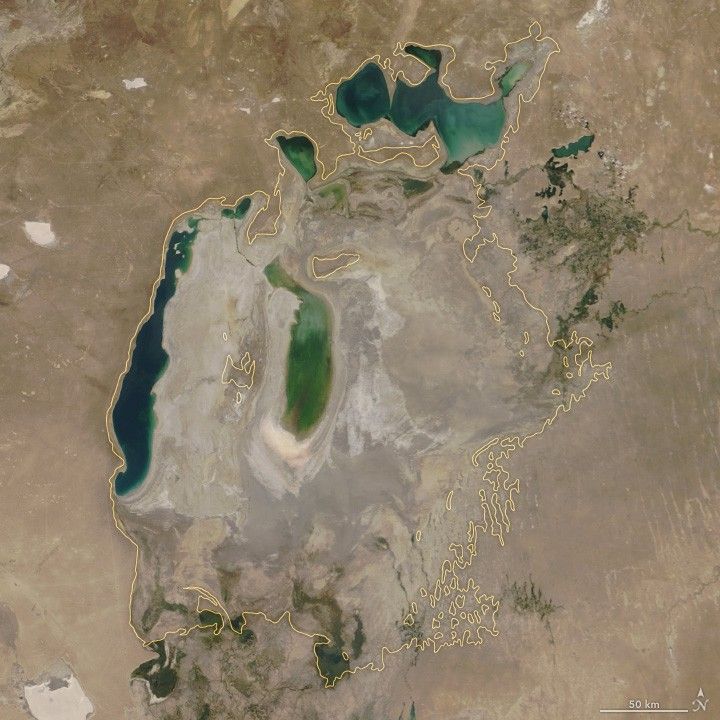
Aral Sea 2000 — NASA MODIS true colour satellite image. Yellow outline shows 1960 shoreline. Lake is severely reduced but still present.
2000 · Still here
Severely reduced
Yellow line = 1960 shoreline. The gap between line and water = what cotton consumed.
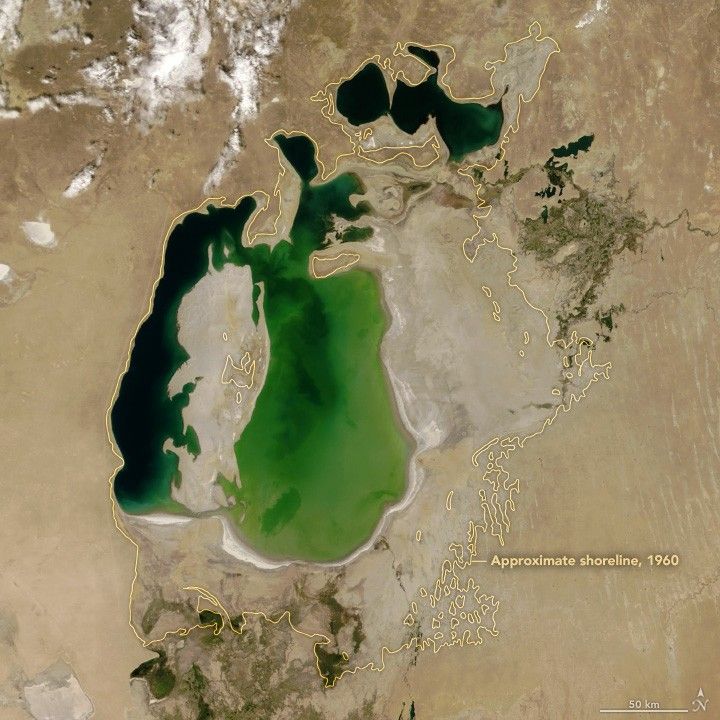
Aral Sea 2018 — NASA MODIS true colour satellite image. Yellow outline shows 1960 shoreline. Inside the outline is now mostly desert.
2018 · Nearly gone
<5% of original size
Everything inside that yellow outline was water 60 years ago.
📡 NASA Earth Observatory · MODIS · True Colour · Public Domain
View full 2000–2018 satellite record at NASA →
68,000
km² in 1960
~0
km² by 2014
3.5M
livelihoods lost
Cotton
the only cause
// Aral Sea · Satellite Data Record
1960 — Surface area68,000 km²
1987 — After Soviet irrigation27,000 km²
2007 — Lake classifiedLargely gone
2014 — Eastern basinCompletely dry
Primary causeVirtual water export
UN classification"Worst disaster"
Cotton water cost2,700L / garment
"One of the planet's worst environmental disasters."
— UN Secretary General Ban Ki-moon, 2011
Why I Built This

A lake that
vanished into cotton

I was sixteen when I first saw a satellite image of the Aral Sea — the world's fourth-largest lake reduced to scattered desert puddles in a single generation. Not by drought. Not by climate change. By the t-shirts and jeans people like me buy without thinking.

The Soviet Union redirected the rivers that fed the sea to irrigate cotton fields. In forty years, a body of water the size of Ireland was gone. 3.5 million people lost their livelihoods. The mechanism was virtual water — the invisible volume of water embedded in every product we consume. This water doesn't appear on any price tag. It just disappears from somewhere else on Earth.

When I understood this, I couldn't unsee it. I opened Thunkable and started building.

Academic Profile

The work behind
the work

National Honours
NSEJS — National Standard Examination in Junior ScienceState Topper & Centre Topper · Top 1% of Delhi · IAPT
State Topper
MVPP — Mukhyamantri Vigyan Pratibha ParikshaDelhi State Rank 20 · Certificate of Merit & Cash Prize
Rank 20
NSTSE — National Science Talent SearchAll India Rank 298 · Class Rank 3 · 81.67%
AIR 298
IOQM — Indian Olympiad Qualifier in MathematicsQualifier · Certificate of Merit Class 9 & 10
Qualifier
Chess — FIDE Rating 1468Dr. Satyapaul Inter-School Certificate of Commendation
1468 FIDE
International Olympiad Record
WMI — World Mathematics Invitational, TaiwanGlobal Rank 3 · Silver Medalist
Global #3
AMC-10 — American Mathematics CompetitionSchool Rank 1 · MAA
School #1
SEAMO & SEAMO-X, SingaporeDual Bronze Medalist · Global Rank 13 · 75th Percentile
Global #13
TIMO — Thailand International Mathematical OlympiadSilver Medalist · Heat Round score of 36
Silver
HKIMO — Hong Kong International Mathematical OlympiadSilver Medalist · Heat Round score of 40
Silver
SASMO — Singapore and Asian Schools Maths OlympiadSilver Medalist · Global Rank 363
Silver
A
Aryan Aggarwal
Student · Developer · Researcher
Delhi Public School, Rohini
About the Founder

I build things
that matter

When I saw what cotton did to the Aral Sea, I didn't write an essay. I opened Thunkable and started building.

I'm Aryan Aggarwal — a student developer and competitive researcher from New Delhi who believes the most important problems are ones most people can't see.

My path to Slow the Flow runs through competitive mathematics. The chess board taught me to think several moves ahead. The olympiad circuit — where I've competed from Taiwan to Singapore to the US — trained me to work under constraint, to find the elegant solution when brute force fails. Global Rank 3 at WMI. State Topper in NSEJS. AMC-10 School Rank 1.

Those aren't separate pursuits from Slow the Flow. They're the same muscle — structured thinking applied to hard problems. I built Slow the Flow alone, from research to APK, while preparing for national science examinations. It's live on the Play Store. It's won a competition. And it's still running.

Engineering

Built to
ship.

Not a school project — a production Android app live on the Google Play Store, built independently using visual and native development frameworks.

Awarded 3rd Position at ROBOTRON Inter-School STEM Fest for mobile coding frameworks.

▶ Google Play Store
Developer Registry IDcom.gmail.aryanchess2.slowtheflow
Build FrameworkThunkable (Native Visual Dev)
DistributionGoogle Play Store ✓ Live
PlatformAndroid + Web
AwardROBOTRON STEM Fest — 3rd Place
Data SourcesUNICEF · CommonDreams · watercalculator.org
StatusActive ✓
💧 💧 💧
Understanding Virtual Water

What is Virtual Water?

The hidden water footprint in everything we consume

💡
Virtual water refers to the total amount of water used to produce goods and services. When you buy a product, you're indirectly consuming all the water that went into making it — from growing raw materials to manufacturing and transportation.

Virtual Water in Common Products

🍫
Chocolate
24,000L
per kg
👕
Cotton Clothes
2,700L
per piece
👖
Denim Jeans
7,200L
per piece
🍗
Chicken (1kg)
4,300L
per kg
Coffee (1 cup)
140L
per cup
🍚
Rice (1kg)
3,400L
per kg
⚠️
By 2040, if current consumption patterns continue, we may face severe water scarcity affecting billions of people worldwide. The Aral Sea — once the world's 4th largest lake — has already dried up largely because of virtual water export through cotton.
🔍
Did you know? A leaky faucet that drips once per second wastes up to 10,000 litres of water per year. Always repair leaky taps immediately!

Your Choices Matter — ready to find out your footprint?

Water Footprint Calculator

Tell Us About
Your Habits

Answer a few questions to calculate your virtual water consumption

How do you take your bath?
🚿
Shower
🪣
Bucket
How many cotton clothes do you buy in a year?
// e.g. t-shirts, shirts, kurtas
Your Water Footprint

Your Results

Here's your annual virtual water consumption

💧
Total Water Consumption
0
litres per year
👥
You're using water for 2 people
That's 2× the average annual water consumption per person
Your breakdown:
📈
But Don't Worry!
We have personalized suggestions to help you reduce your water footprint significantly.
Personalized Recommendations

Your Water-Saving Plan

Follow these tips to reduce your water footprint

You Could Save Up To
0L
of water per year!
🏆 Achievement Unlocked!
🌊
Congratulations!
You're making a real difference for our planet

By following your personalized plan, you will:

2
Give water to 2 people for a year!
based on WHO minimum 50L/person/day
755
People's water for 1 day
at 50L/person/day (WHO)
0.04
Olympic swimming pools
at 2.5M litres each
165
Households' daily water
at 200L/household/day (India avg)
716
Days timeline extended*
*if all 8B people made these changes · Source: UN WWAP
Together, we can #SlowTheFlow and #ExtendTheTime for future generations! 🌍
📐 How we calculated your savings
📱 Share on WhatsApp
// Research Foundation

Sources &
Methodology

Every number in Slow the Flow is sourced from peer-reviewed research, UN agency reports, or internationally recognised water research institutions. This page documents each figure, its source, the year of publication, and how it was applied in the calculator.

Section 01
Water Scarcity Projections — The 2040 Countdown
CLAIM: "By 2040, if current consumption patterns continue, we may face severe water scarcity affecting billions."
Source 1: UNICEF — "Water Scarcity" (unicef.org/wash/water-scarcity)
Source 2: Common Dreams — "There Will Be No Water" (2014/07/30)

The UN and UNICEF project that by 2025, two-thirds of the world's population may face water stress conditions. The 2040 figure represents the projected point at which current freshwater extraction rates become unsustainable globally, based on WWAP (World Water Assessment Programme) modelling of agricultural, industrial, and domestic demand growth against aquifer depletion rates.

unicef.org/wash/water-scarcity ↗ Common Dreams 2014 ↗
Section 02
WHO Minimum Water Standard — 50L/Person/Day
FIGURE USED: 50 litres per person per day = 18,250 litres per person per year
Source: WHO — "Domestic Water Quantity, Service Level and Health" (Gleick, 1996; Howard & Bartram, 2003)
Document: WHO/SDE/WSH/03.02 — Geneva, 2003

The World Health Organization defines the minimum water requirement for basic human needs as 50 litres per person per day. This covers: drinking water (2–5L), sanitation (20L), bathing (15L), and food preparation (10L). This is the figure used in Slow the Flow to convert water savings into "people supplied for a year."

How it's used in the calculator:
If you save 99,350L/year → 99,350 ÷ 18,250 = 5.4 people's annual water supply
WHO/SDE/WSH/03.02 (2003) ↗
Section 03
Virtual Water Coefficients — Product Footprints

The concept of "virtual water" was introduced by Professor John Allan (SOAS, University of London) in 1993. The Water Footprint Network, founded by Professor Arjen Hoekstra (University of Twente), maintains the global database of water footprint per product. All figures below are from their published research.

Product
Our Figure
Unit
Source
🍫 Chocolate / Cocoa
24,000L
per kg
Mekonnen & Hoekstra (2010) — UNESCO-IHE
👕 Cotton clothing
2,700L
per piece
WFN — Cotton: 10,000L/kg × avg 270g garment
👖 Denim jeans
7,200L
per piece
Levi Strauss Life Cycle Assessment (2015)
🍗 Mutton / Chicken
15,400L
per kg
Mekonnen & Hoekstra (2012) — Water Footprint of Farm Animals (chicken: 4,300L/kg; mutton: 10,400L/kg)
☕ Coffee (1 cup)
140L
per cup
Hoekstra & Chapagain (2007) — Water Footprint of Coffee
🍚 Rice
3,400L
per kg
Mekonnen & Hoekstra (2011) — WFN Research Report 47
💧 Leaky tap
10,000L
per year
USGS Water Science School — Drip Calculator (2016)
WFN National Footprints ↗ Hoekstra & Chapagain (2007) ↗ watercalculator.org ↗
Section 04
India Household Daily Water Use — 200L/Household
FIGURE USED: 200 litres per household per day (urban India average)
Source 1: Bureau of Indian Standards IS:1172 — Code of Basic Requirements for Water Supply, Drainage and Sanitation
Source 2: Ministry of Jal Shakti, GoI — "Jal Jeevan Mission" benchmark: 55L/person/day rural, 135L/person/day urban
Source 3: CPHEEO Manual on Water Supply — 135L/person/day for cities <1 lakh population

The 200L/household/day figure is derived from the Indian government's urban water supply standard of 135L/person/day × an average urban household size of 4.4 persons (Census 2011) ≈ 594L/day for large cities. We use 200L as a conservative baseline for a smaller household / semi-urban context. The Jal Jeevan Mission (2019) sets a minimum of 55 litres per person per day for rural households as the Functional Household Tap Connection (FHTC) standard.

Jal Jeevan Mission ↗ BIS IS:1172 ↗
Section 05
Global Freshwater Use — UN WWAP / "Days Extended" Calculation
FIGURE USED: Global freshwater withdrawal ≈ 4,600 km³/year = 4.6 × 10¹⁵ litres/year
Source: UN World Water Assessment Programme (WWAP) — "The United Nations World Water Development Report 2019: Leaving No One Behind"
Published by: UNESCO, Paris, 2019 — ISBN 978-92-3-100309-7
Also: FAO AQUASTAT — Global water withdrawal data (2020 update)

According to UN WWAP (2019), global freshwater withdrawal is approximately 4,600 km³ per year and rising at roughly 1% per year due to population growth, economic development, and changing consumption patterns. Agriculture accounts for ~70%, industry ~20%, and domestic use ~10%.

// "DAYS EXTENDED" CALCULATION METHODOLOGY
Global annual freshwater use = 4,600 km³ = 4.6 × 10¹⁵ L/year
Daily global freshwater use = 4.6 × 10¹⁵ ÷ 365 = 1.26 × 10¹³ L/day
World population = 8 × 10⁹ people
If every person saves X litres/year:
Total global savings = X × 8 × 10⁹ litres
Days extended = (X × 8×10⁹) ÷ (4.6×10¹⁵ ÷ 365)
Note: This is a simplified model. Actual timeline depends on aquifer recharge rates, climate patterns, and consumption trajectories. The figure represents the proportional contribution of behavioural change to extending freshwater availability.
UN WWDR 2019 ↗ FAO AQUASTAT ↗
Section 06
Aral Sea Data
Year
Surface Area
Note
1960
68,000 km²
4th largest lake in the world
1987
27,000 km²
Split into North and South Aral Sea
2007
10% remains
NASA satellite imagery confirmed
2014
Eastern basin dry
First time in 600 years

The Aral Sea data is documented by NASA Earth Observatory, UNEP (United Nations Environment Programme), and the UN Secretary-General's 2011 address. The Soviet Irrigation Programme beginning in the 1960s diverted the Amu Darya and Syr Darya rivers to irrigate cotton fields in Uzbekistan and Turkmenistan, resulting in the near-total disappearance of the lake within 50 years.

NASA Earth Observatory ↗ UNEP — Dying & Dead Seas ↗
Section 07
Bathing Water Use — Shower vs Bucket
Method
Water Used
Source
🚿 Shower (5 min)
~70L
CPCB India; avg flow rate 12–15 L/min
🪣 Bucket bath
~10L
Ministry of Jal Shakti; standard 10L bucket
Annual saving
21,900L
60L/day × 365 days
CPCB India ↗
📚 Complete Reference List
[1] Hoekstra, A.Y. & Chapagain, A.K. (2007). Water footprints of nations: Water use by people as a function of their consumption pattern. Water Resources Management, 21(1), 35–48.
[2] Mekonnen, M.M. & Hoekstra, A.Y. (2010). The green, blue and grey water footprint of crops and derived crop products. UNESCO-IHE, Delft. Value of Water Research Report Series No. 47.
[3] Mekonnen, M.M. & Hoekstra, A.Y. (2012). A global assessment of the water footprint of farm animal products. Ecosystems, 15(3), 401–415.
[4] Howard, G. & Bartram, J. (2003). Domestic Water Quantity, Service Level and Health. WHO/SDE/WSH/03.02. World Health Organization, Geneva.
[5] UN WWAP (2019). The United Nations World Water Development Report 2019: Leaving No One Behind. UNESCO, Paris. ISBN 978-92-3-100309-7.
[6] Levi Strauss & Co. (2015). The Life Cycle of a Jean: Understanding the Environmental Impact of a Pair of Levi's® 501® Jeans.
[7] NASA Earth Observatory. World of Change: Aral Sea (1977–2024). science.nasa.gov/earth/earth-observatory/world-of-change/aral-sea/
[8] UNICEF. Water Scarcity. unicef.org/wash/water-scarcity
[9] Ministry of Jal Shakti, Government of India. Jal Jeevan Mission — Every Household Tap Water. jaljeevanmission.gov.in
[10] FAO AQUASTAT. Global Water Information System. fao.org/aquastat/en
[11] USGS Water Science School. Drip Calculator. water.usgs.gov/edu/activity-drip.html
// Built by
Aryan Aggarwal
Student Developer · Delhi Public School, Rohini · Delhi, India